


The 9 Reasons Why Australia Should Go Vegan.

Australians should replace the animal products they consume with plant-based alternatives. Here are nine reasons why:
For your health:
1. Vegetarians and vegans are Australia’s healthiest eaters according to nation’s largest ever diet study by the CSIRO.

Australia’s vegetarians and vegans have the best quality diet among the population, according to the country’s largest ever diet study, the CSIRO Healthy Diet Score 2016.1 Surveying 86,500 Australians, it compared the eating habits of the typical adult with those who follow special diets, such as low-carb and low-fat. ‘Those avoiding meat or animal products (vegetarians or vegans) had the highest Diet Score,’ the CSIRO reports.2
2. Plant-based diets reduce risk of chronic disease, including obesity, heart disease, type 2 diabetes and some cancers.
Australia’s biggest killer is chronic disease. Our current eating habits, which the CSIRO describes as a ‘shocker,’ are behind growing rates of obesity, heart disease, type 2 diabetes, and one-third of all cancers.3
Not only are well-planned vegetarian and vegan diets ‘healthy and nutritionally adequate,’4 according to the Australian Dietary Guidelines, they are associated with lower ‘all-cause and cardiovascular mortality.’5 Plant-based diets ‘help reduce risk of heart disease, type 2 diabetes, obesity, and some types of cancer.’6
3. Animal agriculture is linked to pandemics. Most new infectious diseases originate in animals eaten by humans, including HIV-1, SARS, bird flu, swine flu, and COVID-19.
Bird flu. Swine flu. Mad Cow disease. About ¾ of new or emerging human infectious diseases originated from animals.7 In particular, ‘the human quest for more animal-source food’ has been linked to the transmission and spread of most recent diseases, such as SARS, HIV-1 and novel influenzas, according to the Food and Agriculture Organization of the United Nations (FAO).8
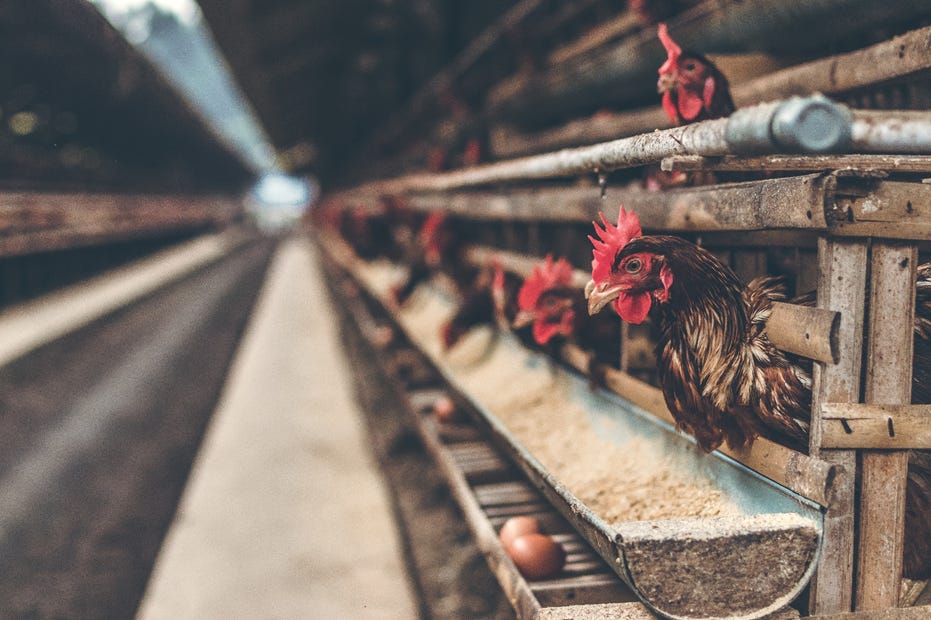
The FAO warns that ‘the rapid growth in livestock production and supply chains is creating public health threats associated with an animal-to-human pathogen shift, which implies pandemic risk’.9 Australia is not immune to this risk. In 2020, the country’s largest ever bird flu outbreak hit Victoria’s egg and poultry industries.10 Efforts to contain the virus’ spread involved the culling of half a million chickens and turkeys.11
COVID-19 also originated from an animal source, probably a bat.12 The transmission to humans most likely occurred at a live animal market, or ‘wet market,’ in Wuhan, China.13
For our environment:
4. Animal agriculture is by far Australia’s biggest driver of deforestation and habitat loss. It is responsible for ¾ of nationwide land clearing.

Three-quarters (76%) of land clearing in Australia is for animal agriculture. An average of 334 thousand hectares of forest land were cleared per year to graze and intensively rear farm animals between 2015 and 2019, according to the latest figures available in Australia’s National Inventory Report.14 15 Only 4% of land clearing was for crop farming by comparison.16 Every ‘other’ purpose combined, from plantations to mining to residential infrastructure, amounted to 20%. Really, there is one main driver of Australia’s deforestation problem: animal agriculture.
5. The livestock industry is the country’s 2nd largest emitter of greenhouse gases. In the 2010s, it produced 20% of Australia’s emissions. Meat was worse for climate change than driving cars.
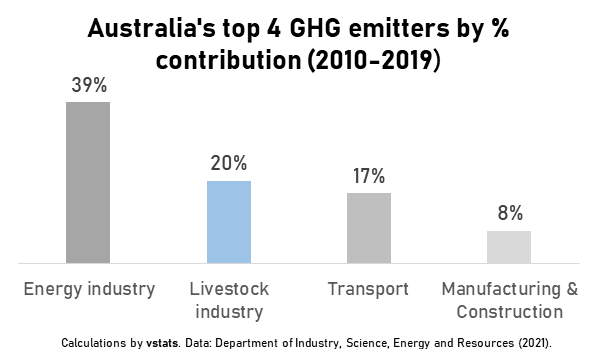
Animal agriculture was responsible for one-fifth (20%) of Australia’s greenhouse gas emissions in the 2010s.17 The livestock industry produced 1.1 billion tonnes of emissions over the decade according to government figures.18 Most of these emissions are from the methane released by farm animals19 and forest land cleared for grazing.20 For comparison, crop farming emitted only 3% of Australia’s greenhouse gases.21
The livestock industry is the country’s second largest emitter behind the energy industry.22 That also makes it a bigger contributor to climate change than the entire transportation sector. Rearing animals for food and fibre releases more emissions than travel by cars, trucks, buses, rail and domestic flights combined. Deep cuts in our emissions require deep cuts in our meat intake.
6. Two-thirds of domestic grain-use is for feeding and fattening farm animals. Animal products require much more grain than plant-based alternatives.

It takes a lot of grain to make a bit of meat. The livestock industry is ‘by far the largest domestic market for Australian grain,’ according to the industry’s own Feed Grain Supply and Demand report.23 The latest industry figures reveal that two-thirds (68%) of grain-use within Australia went towards feeding livestock in 2017-18.24 It reached nearly 11 million tonnes of grain. For comparison, only 3 million tonnes of grain were needed to satisfy Australia’s demand for flour. Much more grain ends up being required to produce animal products compared to plant-based alternatives.
For the animals:
7. Over six billion Australian farm animals were slaughtered for meat in the 2010s.

Australian slaughterhouses churned through billions of lives last decade. From 2010 to 2019, 6.3 billion farm animals25 – cows and calves, sheep and lambs, pigs, and chickens – were slaughtered and butchered for their meat in this country.26
The numbers killed escalated over the decade. By 2020, a new industry milestone was reached, annual slaughters surpassed 700 million. That is nearly 2 million livestock killings per day.
Meat eating subjects Australia’s farm animals to extreme violence on a scale that is hard to fathom.
8. Australians can personally spare 2,000+ farm animal lives with a meat-free diet.
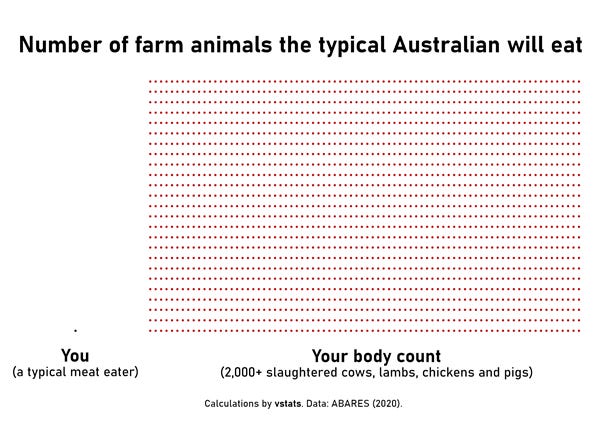
The typical Australian will eat more than two thousand farm animals during their life.27
On average, people consume around 109kg of meat per year.28 Based on current dietary habits, 25 livestock animals – chickens, lambs, pigs and cows – must be slaughtered to supply the particular types and amounts of meat that Australians are eating annually.29 This adds up to at least 2,064 farm animals being killed for meat over a regular lifespan30.
By cutting meat from your diet, you can spare up to thousands of lives.
9. Concern for the welfare of farm animals is growing among the Australian public. Recognition of animal sentience is behind changing attitudes.
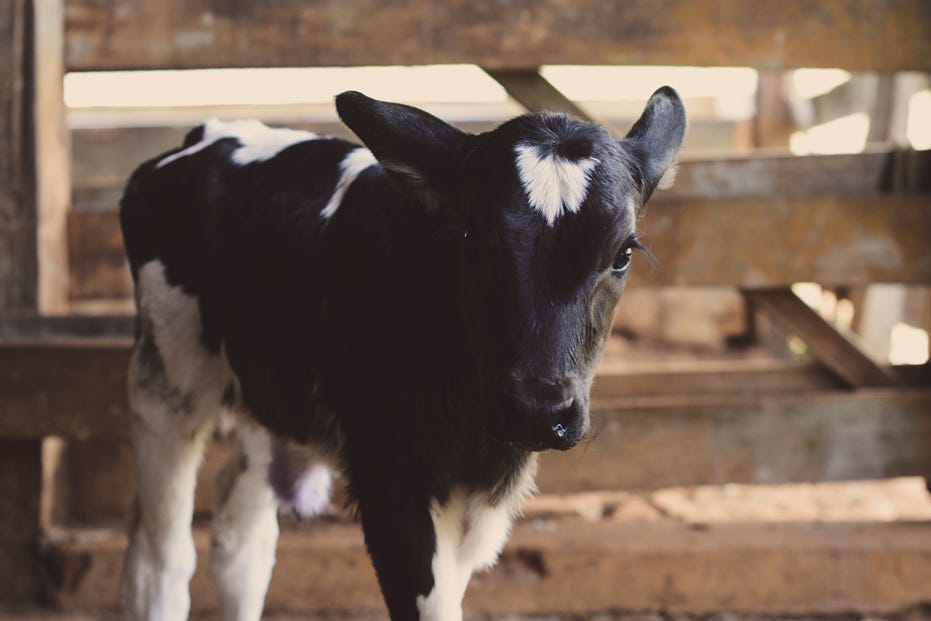
Concern for the welfare of farm animals is growing among the Australian people, according to a recent survey commissioned by the government.31
Around 85% of the public believe that animals should have ‘freedom from pain, injury or disease.’32 Six in ten view factory farming as ‘indefensible.’33 More Australians even agree than disagree that it is ‘unfair’ to breed and kill animals for human consumption.34
Public attitudes are changing due to increased recognition of animal sentience.35 Most Australians now agree that animals are aware of their surroundings, form complex social bonds, experience physical and emotional sensations, and seek positive experiences.36
Australians who accepted that animals are sentient were also likely to agree with sentiments supporting animal rights.37 Explaining this close alignment, the survey makes a simple but fitting point to end on: if there is recognition that farm animals can perceive and feel, then ‘it is logical to believe that these capabilities should be safeguarded through the adoption of rights and freedoms.’38
Hendrie, G., Baird, D., Golley, S., & Noakes, M. (2016, September). CSIRO Healthy Diet Score 2016. https://www.totalwellbeingdiet.com/media/2127/2016-csiro-healthy-diet-score.pdf
Hendrie, Baird, Golley, & Noakes. CSIRO Healthy Diet Score 2016. See p. 36.
CSIRO. (2016, 26 September). C’mon Aussie. Your diet’s a shocker. https://www.csiro.au/en/news/news-releases/2016/cmon-aussie-your-diets-a-shocker
National Health and Medical Research Council. (2013). Australian Dietary Guidelines: providing the scientific evidence for healthier Australian diets.https://www.eatforhealth.gov.au/sites/default/files/content/n55_australian_dietary_guidelines.pdf. See p. 35.
National Health and Medical Research Council. (2013). Australian Dietary Guidelines. See p. 1.
Healthdirect Australia. (2019, December). Vegetarian and vegan diets. https://www.healthdirect.gov.au/vegetarian-and-vegan-diets
Centers for Disease Control and Prevention. (2017, 14 July). Zoonotic Diseases. https://www.cdc.gov/onehealth/basics/zoonotic-diseases.html
Food and Agriculture Organization of the United Nations (FAO). (2013). World Livestock 2013: Changing disease landscapes. http://www.fao.org/3/i3440e/i3440e.pdf. See p. 2.
FAO. World Livestock 2013. See p. 3.
Wakatama, G. (2020, 5 October). Devastating bird flu outbreak in Victoria sees NSW prepare for the worst. https://www.abc.net.au/news/2020-10-05/nsw-sets-up-bird-flu-incident-management-team/12730286
Wakatama. Devastating bird flu outbreak.
Centers for Disease Control and Prevention. (2021, 4 June). Animals & COVID-19. https://www.cdc.gov/coronavirus/2019-ncov/daily-life-coping/animals.html
Maxmen, A. (2021, 31 March). WHO report into COVID pandemic origins zeroes in on animal markets, not labs. https://www.nature.com/articles/d41586-021-00865-8
Department of Industry, Science, Energy and Resources. (2021). National Inventory Report 2019: Volume 2. https://www.industry.gov.au/sites/default/files/April%202021/document/national-inventory-report-2019-volume-2.pdf. See pp. 313-324, Table 6.L.2 Activity in ABARES Land Use regions, 5 years to June 2019 (kha).
Data also available at:
Department of Industry, Science, Energy and Resources. (2021). Data Tables – Activity Table 1990-2019 – LULUCF. https://ageis.climatechange.gov.au/QueryAppendixTable.aspx
Forest land clearing for animal agriculture includes the primary conversion and re-clearing for the following categories: ‘2.1 Grazing native vegetation,’ 3.2 Grazing modified pastures,’ 4.2 Grazing irrigated modified pastures,’ and ‘5.2 Intensive animal production.’
Forest land clearing for crop farming includes the primary conversion and re-clearing for the following categories: ‘3.3 Cropping,’ ‘3.4 Perennial horticulture,’ ‘3.5 Seasonal horticulture,’ ‘3.6 Land in transition,’ ‘4.0 Production from irrigated agriculture and plantations,’ ‘4.3 Irrigated cropping,’ ‘4.4 irrigated perennial horticulture,’ ‘4.5 Irrigated seasonal horticulture,’ ‘4.6 Irrigated land in transition,’ and ‘5.1 Intensive horticulture.’
Over the decade (2010 to 2019), Australia’s net emissions reached 5.5 billion tonnes of CO2-e.
Emissions related to animal agriculture is calculated by adding together two sub-categories found in the ‘agriculture’ section, ‘enteric fermentation’ and ‘manure management,’ with ‘grassland’ emissions recorded in LULUCF, covering the years 2010 to 2019. Spanning this period, CO2-e emissions reached 575 million tonnes for enteric fermentation, 73 million tonnes for manure management, and 478 million tonnes for grassland. It combines to a total of 1,126 million tonnes CO2-e across the decade. Data available at: Department of Industry, Science, Energy and Resources. (2021). National Greenhouse Gas Inventory – Paris Agreement Inventory. https://ageis.climatechange.gov.au/
Enteric fermentation and manure management measure the methane and nitrous oxide emissions that are released by livestock and their waste products. See: Australian Government Department of Industry, Science, Energy and Resources. (2020). National Inventory Report 2018: Volume 1. https://www.industry.gov.au/sites/default/files/2020-05/nga-national-inventory-report-2018-volume-1.pdf. See pp. 283-285.
Grassland measures emissions from land-cleared and managed areas that ‘are used for extensive grazing of both sheep and cattle.’ See: Australian Government Department of Industry, Science, Energy and Resources. (2020). National Inventory Report 2018: Volume 2. https://www.industry.gov.au/sites/default/files/2020-05/nga-national-inventory-report-2018-volume-2.pdf. See p. 15.
Crop farming emissions are calculated by taking the total emissions from the ‘agriculture’ section less ‘enteric fermentation’ and ‘manure management’ and then adding ‘cropland’ emissions from the LULUCF section. It amounted to 0.2 billion tonnes CO2-e from 2010 to 2019.
In the 2010s, CO2-e emissions reached 2.2 billion tonnes for energy industries, 0.9 billion for transport, and 0.4 billion for manufacturing industries and construction.
Spragg, J. (2018). Australian Feed Grain Supply and Demand Report 2018. Feed Grain Partnership/JCS Solutions. http://www.feedgrainpartnership.com.au/items/1023/FGP%20Feed%20Grain%20Supply%20and%20Demand%20Report%20Oct%202018.pdf. See p. 22.
Spragg. Australian Feed Grain Supply and Demand Report 2018. See p. 25, Table 6.
The terms ‘farm animals’ and ‘livestock’ in this piece cover only slaughters of cattle and calves, lambs and sheep, pigs, and meat chickens. Estimates of other livestock killed in animal agricultural production, such as layers in the egg industry or fish in aquaculture, are not provided due to insufficient data.
Estimates are based on data published by the Australian Bureau of Agricultural and Resource Economics and Sciences. See:
Australian Bureau of Agricultural and Resource Economics and Sciences (ABARES). (2020). Agricultural commodities: December quarter 2020 - Statistics [Datafile and codebook]. https://www.agriculture.gov.au/abares/research-topics/agricultural-outlook/data#agricultural-commodities. See Table 12.
Estimate only considers cattle and calves, sheep and lambs, pigs, and chickens. Other animals killed for meat (e.g., fish) are not included in the estimation due to insufficient data.
Measured by carcase weight. Data on meat production and consumption in Australia is available at:
Australian Bureau of Agricultural and Resource Economics and Sciences. (2020). Agricultural commodities: December quarter 2020 – Statistics [Datafile and codebook]. https://www.agriculture.gov.au/abares/research-topics/agricultural-outlook/data#agricultural-commodities. See Table 12.
Australian Bureau of Agricultural and Resource Economics and Sciences. (2020). Agricultural commodity Statistics 2020 [Datafile and codebook]. https://www.agriculture.gov.au/abares/research-topics/agricultural-outlook/data#2020. See Table 12.1.
This figure is according to a ten-year average of Australian meat production and consumption data [see footnote 4] during the 2010s (2009-10 to 2018-19). It reports that 629 million livestock animals are slaughtered in Australia per year, including 8.5 million cows and calves, 29 million sheep and lambs, 4.9 million pigs and 587 million chickens. Measured by carcase weight, annual meat production yielded 2.3 billion kilograms of beef, 654 million kg of sheep meat, 372 million kg of pig meat, and 1.1 billion kg of chicken. Measured by carcase weight, an Australian eats 28kg of beef, 9kg of sheep meat, 27kg of pig meat, 45kg of chicken each year.
The estimation involves multiplying a ratio of livestock slaughters per kilogram of meat (e.g. cattle slaughtered per kg of beef harvested) by the per capita consumption figure (e.g. 28kg of beef). This gives us slaughters per person per year for each meat type. It works out to a sum total of 25 farm animals being killed annually to satisfy the consumption habits of each Australian. Projecting this figure over the lifespan of the typical person, nearly 83 years here, the number of livestock being killed would reach 2,064 animals, including 1,994 chickens, 32 sheep and lambs, 29 pigs and 9 cows and calves.
United Nations Department of Economic and Social Affairs. (2019). World Population Prospects 2019 – Mortality data [Datafile and codebook]. https://population.un.org/wpp/Download/Standard/Mortality/
The survey was performed at the request of the Australian Government Department of Agriculture and Water Resources. See:
Futureye. (2018). Australia’s Shifting Mindset on Farm Animal Welfare. https://www.outbreak.gov.au/sites/default/files/documents/farm-animal-welfare.pdf
Futureye. Australia’s Shifting Mindset. See p. 76.
Futureye. Australia’s Shifting Mindset. See p. 76.
Futureye. Australia’s Shifting Mindset. See p. 76.
Futureye. Australia’s Shifting Mindset. See p. 4.
Futureye. Australia’s Shifting Mindset. See pp. 37-38.
Futureye. Australia’s Shifting Mindset. See p. 7.
Futureye. Australia’s Shifting Mindset. See p. 6.