


A quarter of Australia's emissions have come from meat and dairy.
Animal agriculture generated 24% of Australia's net greenhouse gas emissions since 1990.

A majority of young Australians say that livestock production and meat eating do not contribute to climate change, according to a recent survey.1 Thirty years of emissions data say otherwise, however. Not only is animal agriculture a ‘significant contributor’ to climate change at the global level,2 it is a leading source of greenhouse gas emissions at the national level in Australia. Government figures3 covering 1990 to 2020 reveal that animal agriculture was responsible for one-quarter (24%) of Australia’s net emissions.
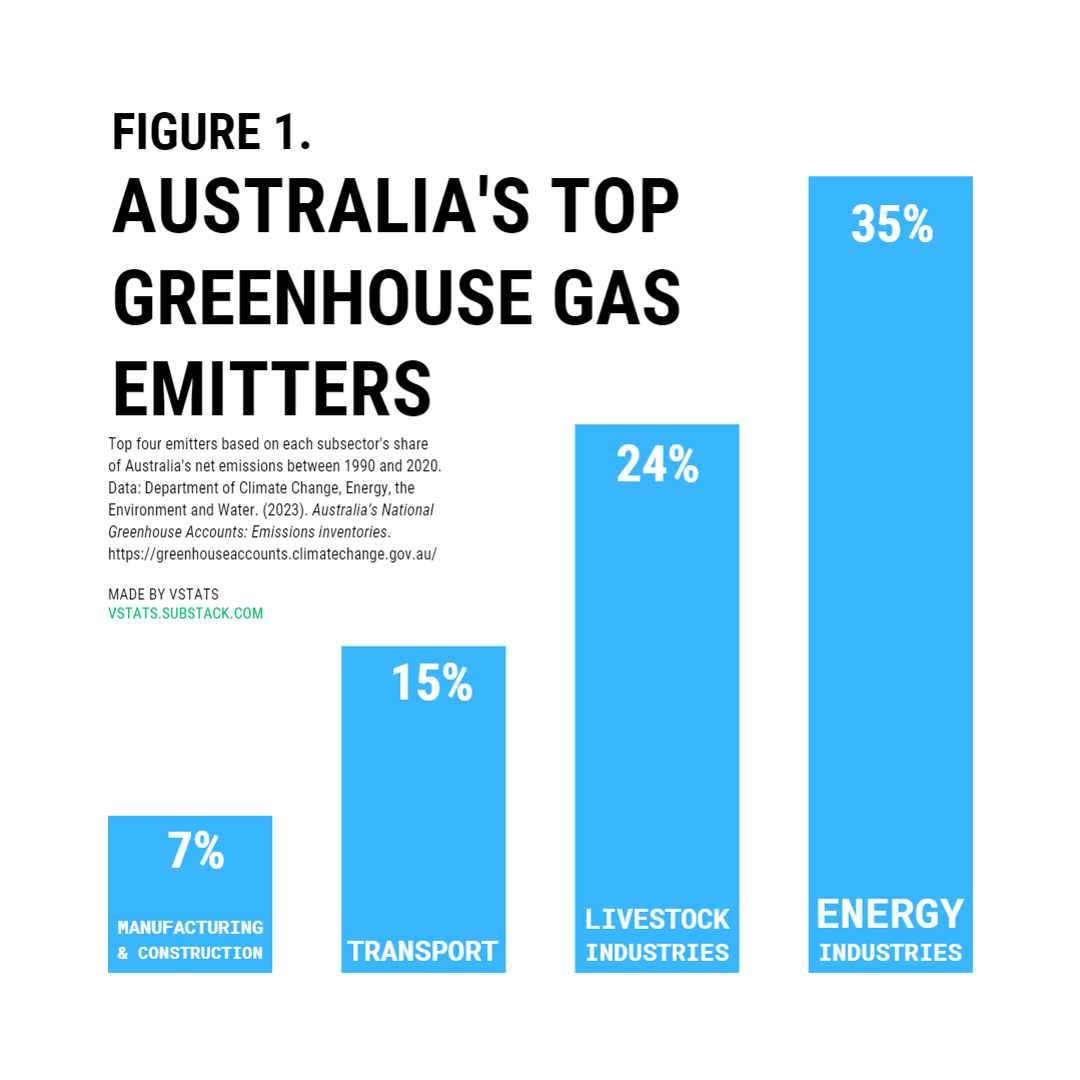
Emissions related to animal agriculture include those released by the livestock animals themselves, their waste products, and land clearing to support grazing activities. It has amassed to 4.2 billion tonnes CO2-e over the past three decades. That positions the livestock industry as the country’s second largest source of emissions behind the energy industry subsector (see Figure 1). It has even been a worse emitter than the entire transport, manufacturing and construction subsectors combined. By comparison, emissions related to crop farming are much lower, only generating 0.8 billion tonnes of CO2-e over the same period, a 5% share of Australia’s net emissions.
To young Australians, most of whom believe we are not doing enough to reduce emissions,4 the evidence is clear: your diet matters.
Eat plants, not animals.
Steps to calculate animal agriculture’s share of emissions:
1. Note that when examining inventory records,5 agricultural-related emissions are actually recorded in two sections – not only the ‘agriculture’ section, but also in the ‘land use, land-use change, and forestry’ (LULUCF) section.6 The LULUCF section tabulates emissions from deforestation and land management activities, and most land clearing in this country is carried out to support agricultural production (e.g., livestock grazing).7 Divvying the sector’s emissions into two sections has the effect of obscuring its full contribution to climate change, however.
Figure 2 breaks down Australia’s net emissions by sector since 1990, in accordance with standard UNFCCC reporting. When deforestation emissions undertaken for cropping and grazing are kept to the LULUCF section, agriculture’s contribution to net emissions appears as a 14% share. Meanwhile, LULUCF represents an 10% share of net emissions.

2. In order to calculate the agriculture sector’s full contribution to climate change, the relevant emissions reported in the LULUCF section can be moved to the agriculture section. In LULUCF, agricultural-related emissions are recorded in the ‘grassland’ and ‘cropland’ sub-categories. Combined these activities generated 2.6 billion tonnes CO2-e since 1990, a 15% share of Australia’s net emissions. Most of the agricultural sector’s contribution to climate change over the last thirty years will be missed by only looking at the ‘agriculture’ section in inventory records. Additionally, without agricultural-related emissions, LULUCF represents a net sink of emissions at -0.9 billion tonnes CO2-e since 1990.
Figure 3 provides a visual display of agriculture’s full contribution to climate change when agricultural-related emissions from LULUCF is shifted to the agricultural section. Agriculture’s share more than doubles to 29% of Australia’s net emissions since 1990. Also note that LULUCF’s contribution turns negative, a -5% net sink.

3. Finally, we can disaggregate agricultural emissions to measure and compare the contributions of livestock and crop production.
Emissions from animal agriculture can be calculated by adding together two subcategories found in the agriculture section, ‘enteric fermentation’ and ‘manure management’ with the ‘grassland’ subcategory in LULUCF. Enteric fermentation and manure management measure the methane and nitrous oxide emissions that are released by livestock and their waste products.8 Over a thirty-year period, emissions from enteric fermentation reached 1.7 billion tonnes CO2-e and manure management totalled 0.2 billion tonnes CO2-e. Grassland measures emissions from land-cleared and managed areas that ‘are used for extensive grazing of both sheep and cattle.’[vi]9 These activities emitted 2.3 billion tonnes CO2-e. When combined, the subcategories total 4.2 billion tonnes CO2-e from 1990 to 2020.
Emissions from crops can be measured by subtracting ‘enteric fermentation’ and ‘manure management’ subcategories from the agriculture section, and then adding the ‘cropland’ subcategory from LULUCF. It generated 0.8 billion tonnes CO2-e since 1990.
This exercise reveals that the overwhelming share (84%) of agricultural-related emissions come from livestock production.
Figure 4 displays agricultural emissions from livestock and crop production as a share of Australia’s net emissions. Animal agriculture is revealed to have emitted one-quarter (24%) of Australia’s greenhouse gases over the last thirty years (1990-2020). Crop farming, in contrast, only generated 5% of net emissions.

Infographics to share:

Notes:
Bogueva, D. & Marinova, D. (2022). Australian Generation Z and the Nexus between Climate Change and Alternative Proteins. Animals 2022, 12(19), 2512, https://doi.org/10.3390/ani12192512
Gerber, P.J., Steinfeld, H., Henderson, B., Mottet, A., Opio, C., Dijkman, J., Falcucci, A. & Tempio, G. (2013). Tackling climate change through livestock – A global assessment of emissions and mitigation opportunities. Food and Agriculture Organization of the United Nations (FAO). http://www.fao.org/3/i3437e/i3437e.pdf. See pp. xii.
Department of Climate Change, Energy, the Environment and Water. (2023, 10 March). Australia’s National Greenhouse Accounts: Emissions inventories. https://greenhouseaccounts.climatechange.gov.au/
Australian Institute for Disaster Resilience and World Vision. (2020). Our World, Our Say: National survey of children and young people on climate change and disaster risk. https://www.aidr.org.au/media/7946/ourworldoursay-youth-survey-report-2020.pdf
Department of Climate Change, Energy, the Environment and Water. (2023, 10 March). Australia’s National Greenhouse Accounts: Emissions inventories. https://greenhouseaccounts.climatechange.gov.au/
Australian Government Climate Change Authority. (2017). Action on the land: Reducing emissions, conserving natural capital and improving farm profitability.https://www.climatechangeauthority.gov.au/sites/default/files/2020-06/Action%20on%20the%20Land/AOTL2%20-%20Issues%20paper%20action%20on%20the%20land%209Mar.pdf. See p. 3.
Australian Government Department of Industry, Science, Energy and Resources. (2022). National Inventory Report 2020: Volume 2. https://www.dcceew.gov.au/sites/default/files/documents/national-inventory-report-2020-volume-2.pdf. See p. 11.
Australian Government Department of Industry, Science, Energy and Resources. (2022). National Inventory Report 2020: Volume 1. https://www.dcceew.gov.au/sites/default/files/documents/national-inventory-report-2020-volume-1.pdf. See pp. 295, 297.
Australian Government Department of Industry, Science, Energy and Resources. (2022). National Inventory Report 2020: Volume 2. https://www.dcceew.gov.au/sites/default/files/documents/national-inventory-report-2020-volume-2.pdf. See p. 17.
Can you please explain a little further the difference between the 35% energy emissions in figure 1 vs the 68% for energy in the pie charts? Thank you.